Objective: Identify the regions in India where crime rate is emerging?
Crimes In India
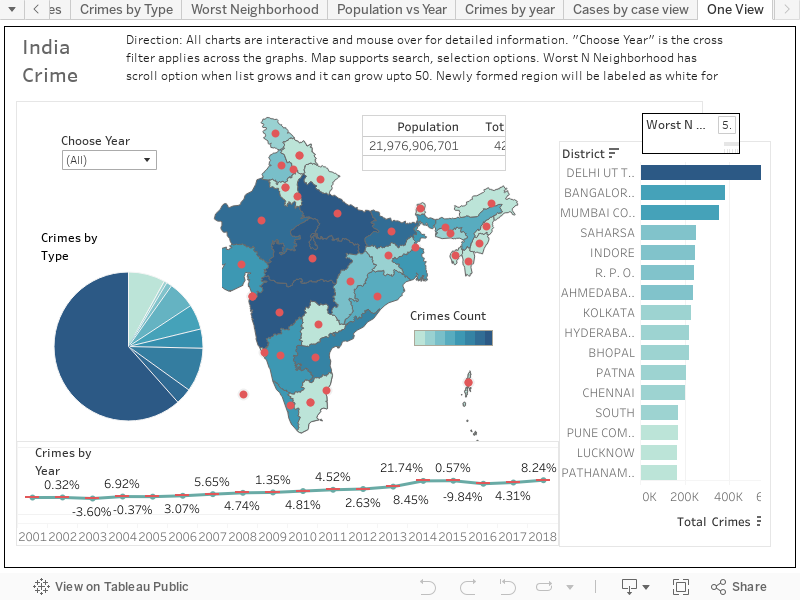
India is a country of diverse cultures, languages, and traditions, but like any other nation, it struggles with the challenge of crime. Over the years, crime rates in the country have fluctuated, a complex picture of social issues and law enforcement challenges. From 2001 to 2018, India reported a staggering 42 million crimes, offering us a unique opportunity to delve into the trends, patterns, and locations of these incidents.
When we examine the data more closely, some intriguing insights emerge. Let’s explore the key findings:
- Regional Variations: crime steadily increased in the North and center regions.
- Hotspots of Crime: crime rates are highest in the states- Madhya Pradesh, Utter Pradesh, Rajasthan and Maharashtra.
- Dominant Crimes: theft is most dominant crime along with murder and rapes. Worst neighborhoods are Delhi, Mumbai, Bangalore etc.
- Troubled Neighborhoods: Highest percentage crime change reported in 2014.
Visualizing the Data
To gain a deeper understanding of these insights, we turn to data visualization through a comprehensive dashboard. Here’s how the charts can help us:
- Geographic Map: go over the map and regions to analyze crimes distribution among 19 states and each state is color ranked with crime intensity. It shows north region has highest number of crimes and further we can analyze crime by category on the mouse over event.
- Pie chart: pie chart is helpful for comparing different crime types. It’s evident that theft dominates the landscape. With a global year filter, you can perform yearly comparisons, and by selecting specific regions on the map, you can make region-wise comparisons..
- Bar Chart: This chart helps us identify the worst neighborhoods or districts in the nation. It’s also integrated with the global year filter.
- Line Chart: to understand how crime has evolved over the years, the line chart shows the percentage crime change year by year. It’s an essential tool for tracking long-term trends.
This data-driven approach, recognizing regions with higher crime rates, dominant crime types, and troubled neighborhoods, policymakers, law enforcement agencies and communities can work together to address these issues effectively.
References
Author: Rahul Sharma